Bixi Analysis
Geo-Statistical Analysis, R, Leaflet
Summary
This project analyzes Montreal’s BIXI bike share system data to uncover usage patterns, popular routes, and station activity. The analysis focuses on temporal patterns across seasons and spatial distribution of rides throughout the city.
Insights


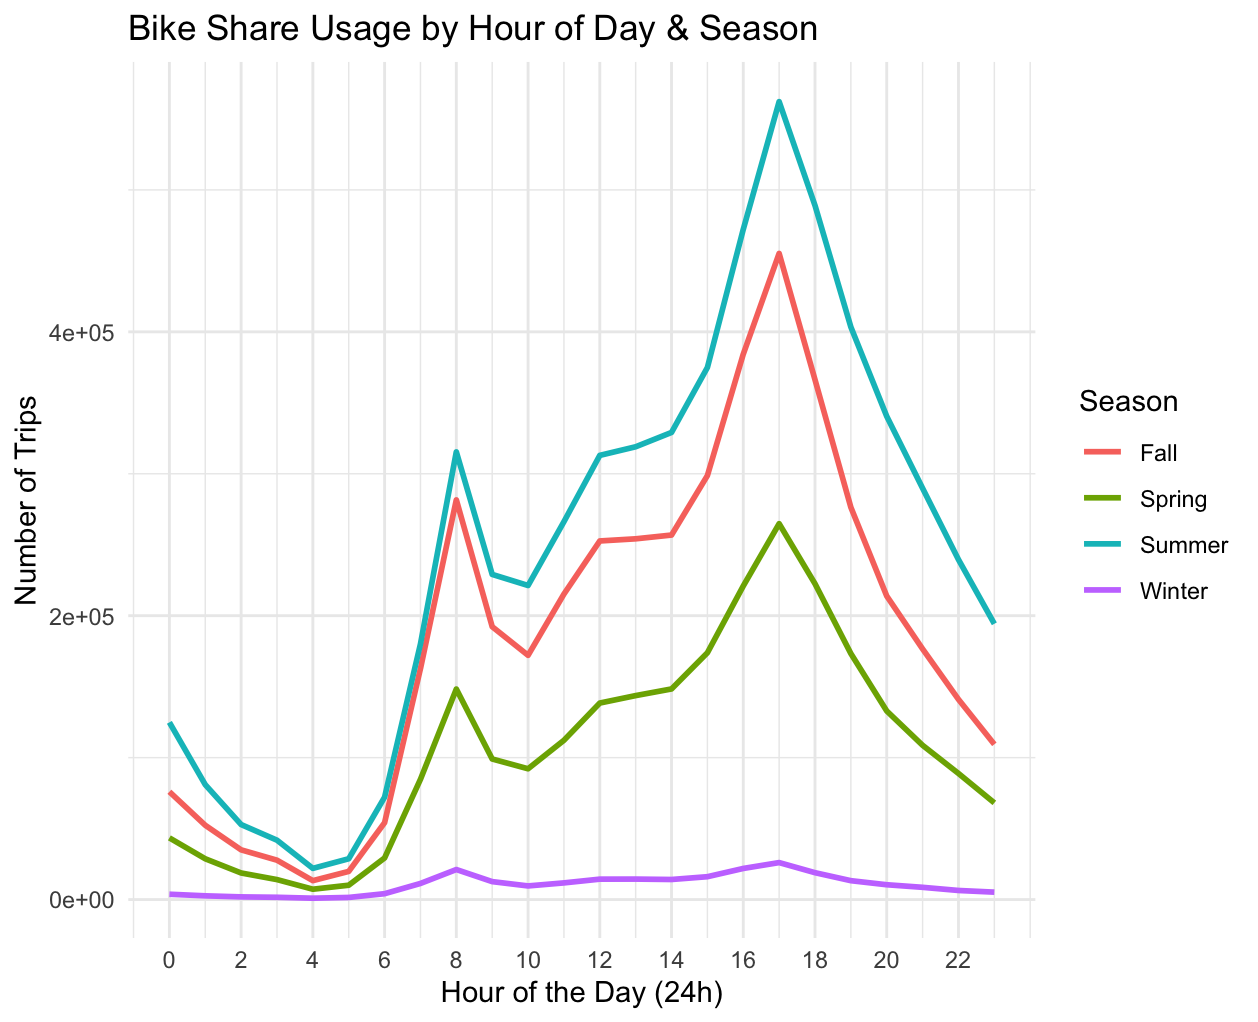
Bike Share Usage by Hour of Day & Season
- Summer is the most popular time
- Across seasons, trips peak at 8am and 3pm
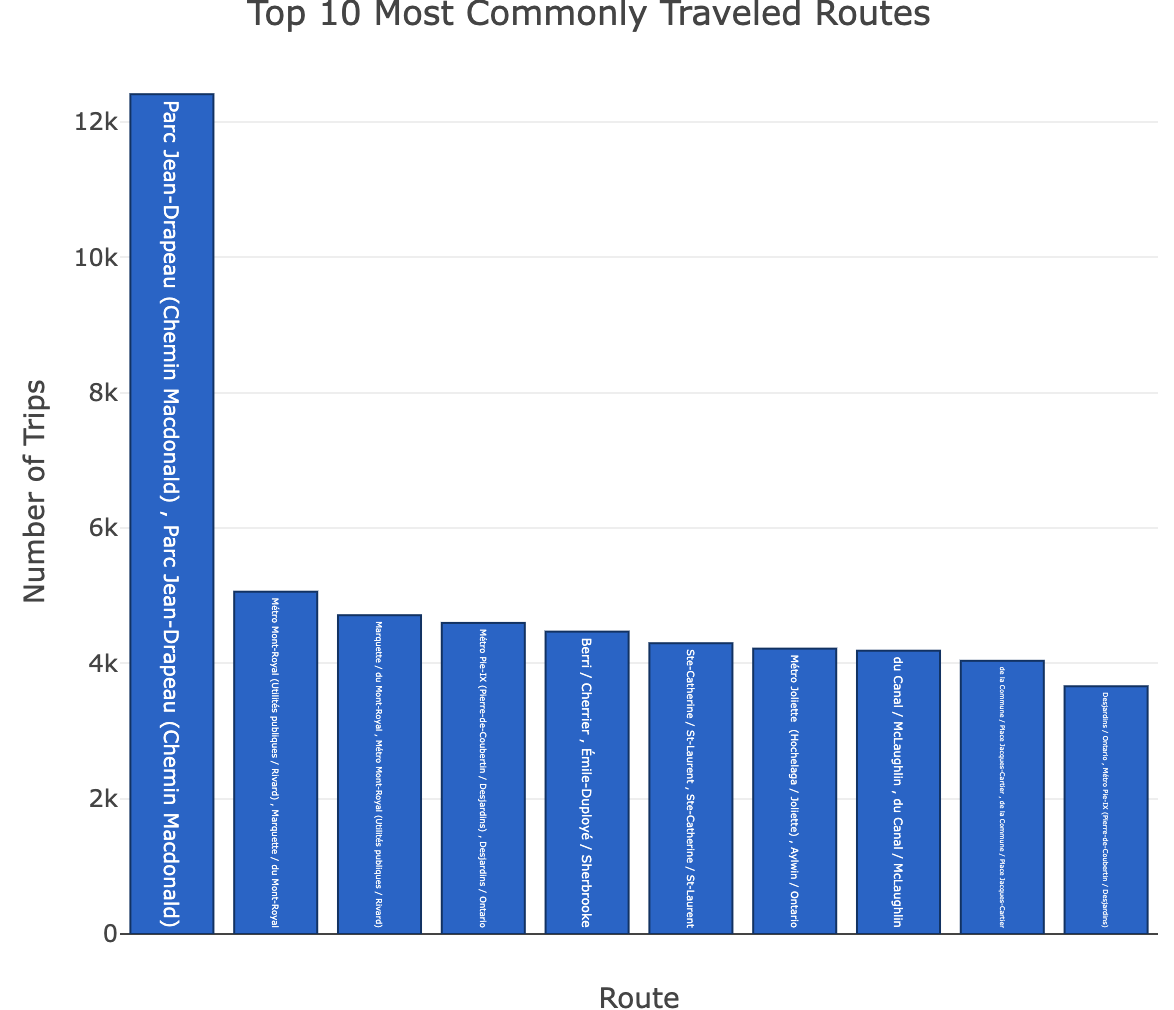
Top 10 Most Common Routes (start station and end station)
- Parc Jean Drapeau to itself is the most popular
Most Popular Start Stations in 2024
Data Structure
The analysis expects a CSV file with the following key columns:
- STARTTIMEMS: Trip start time in milliseconds
- STARTSTATIONNAME: Origin station name
- ENDSTATIONNAME: Destination station name
- STARTSTATIONLATITUDE: Origin station latitude
- STARTSTATIONLONGITUDE: Origin station longitude